Bioweapon_Modelling_Part_4
Publish and be dammed !

Publish and be dammed!
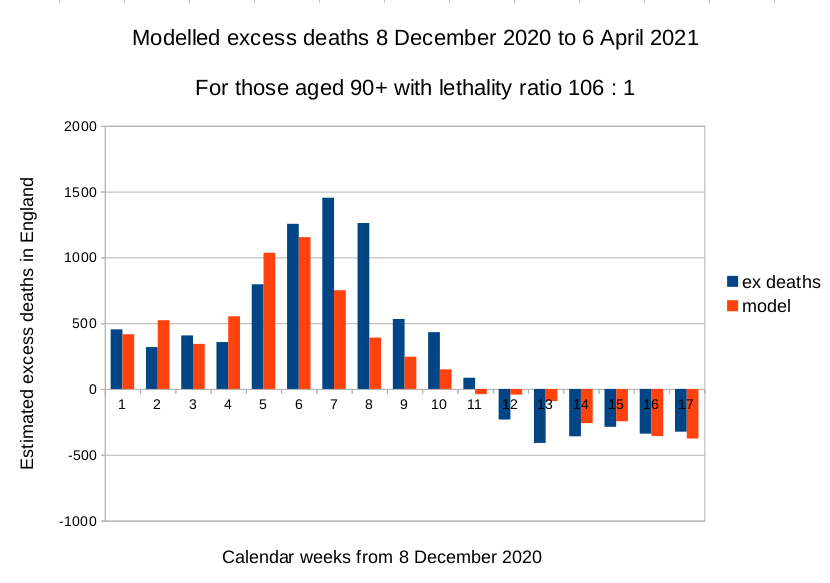
Here is what has happened. I had assembled the data, then did some calculations of those aged 90+ for the 120 days beginning on 8 December 2020, the day that the jabs began. A figure of one excess death per 106 jabs yielded the minimum error.
With that figure of lethality in hand, the jabs and the excess deaths could be profiled via a series of calculations designed to optimise the match between the days the jabs were given and the days when excess deaths occurred.
These calculations became unstable as the calculation closed in on the optimum values. Large changes in some data inputs caused little or no change in the minimums of the errors. At that point the process was considered finished.
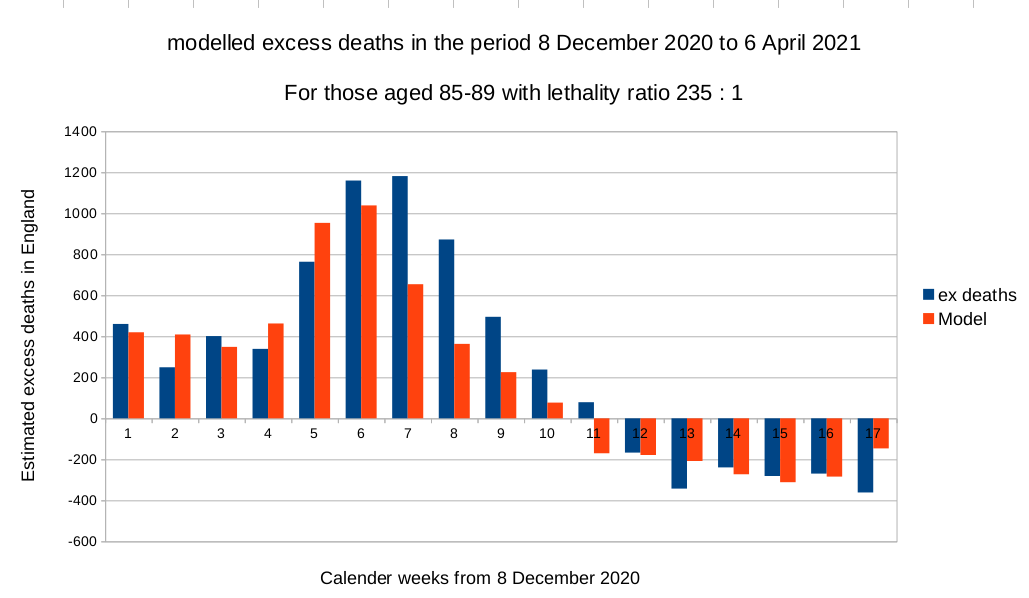
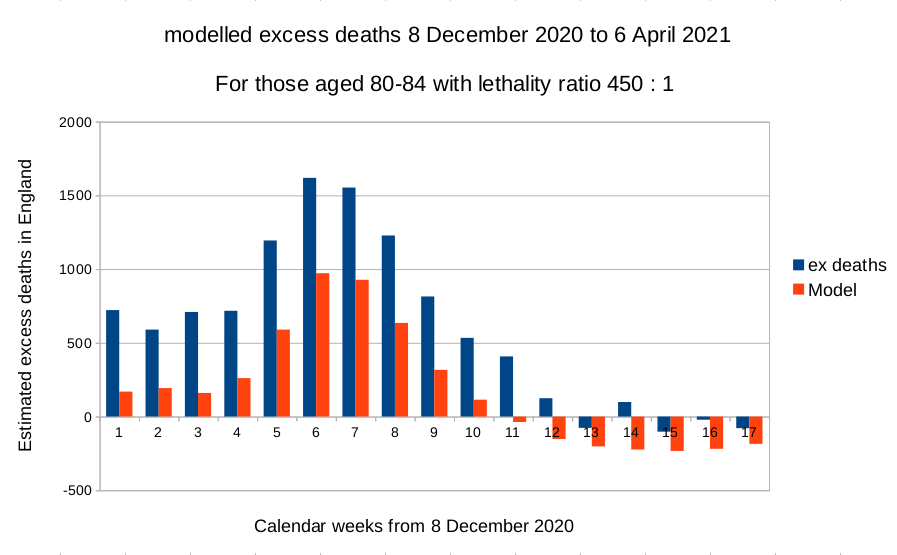
Similar calculations were set in motion for those aged 85-89; 80-84; and 75-79, and the calculations were resolved satisfactorily.
Before moving on to process the data for those aged 74 and younger persons, a quality check began. This revealed differences in the data published by the Office for National Statistics (ONS) for the daily deaths dataset and the data in the weekly deaths dataset. These can no longer be trusted.
These differences are so large that further calculations for younger persons are now on Hold.
What to do? Obviously, try to get answers from the ONS, but that will take some time, probably weeks, if not longer.
And the calculations that are already done?
I have decided to publish these, dammed or not!
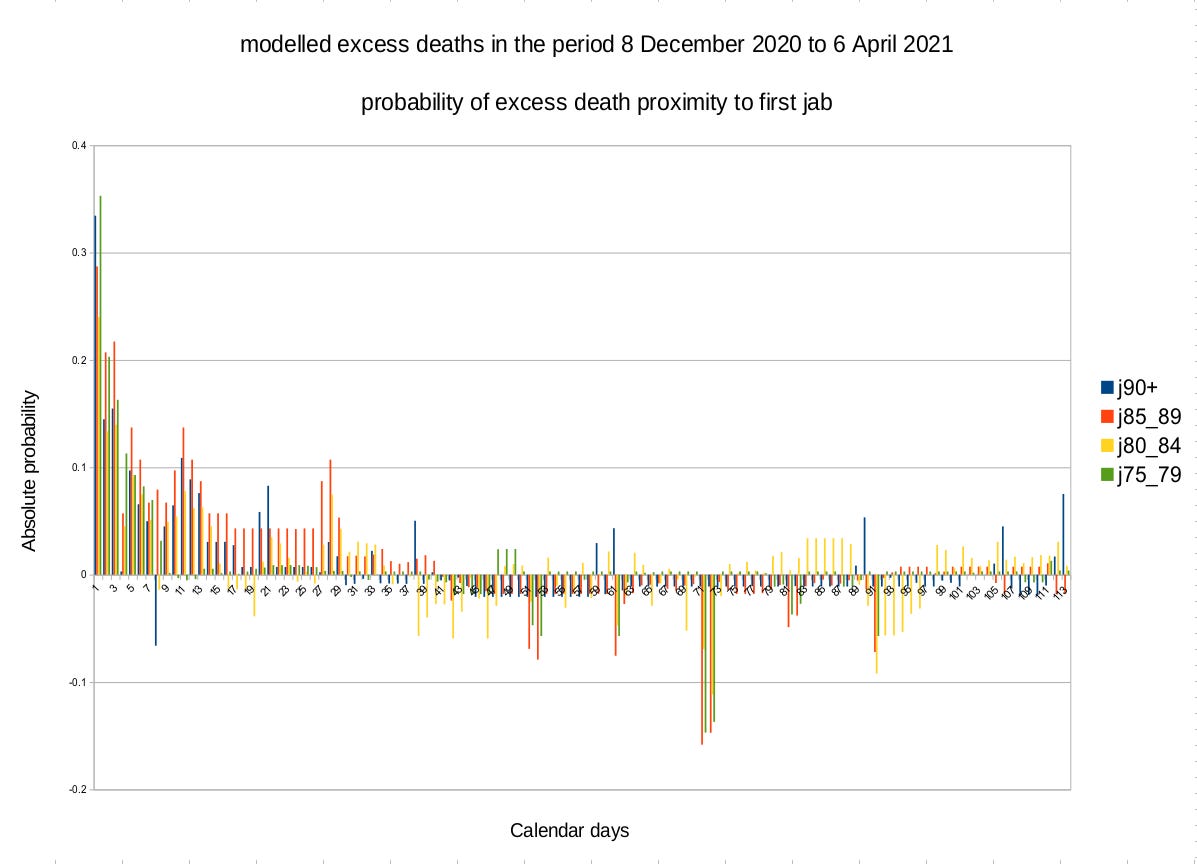
The first chart illustrates the probability of a death close to the day that a jab was delivered. Put simply, half of the excess deaths that might have a causal link to the first jabs occur more than two days after the first jab was given.
The second series of charts model, for each age grouping, the suggested excess deaths based on the modelled lethality, the excess deaths probability and the actual recorded excess days day by day.
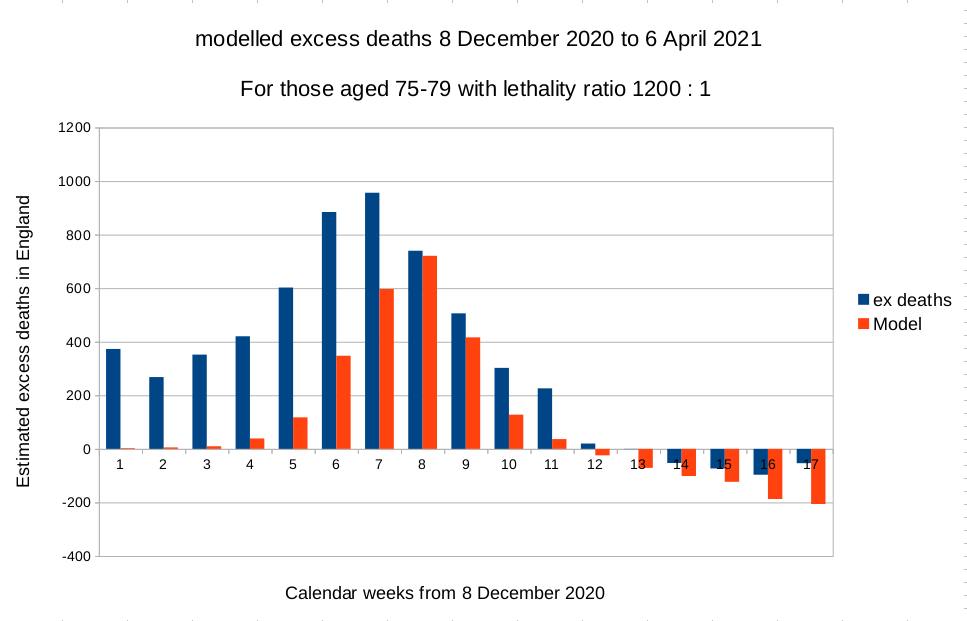
The above charts contain known errors. They are, however, based on the only available data to date.
Note the warning about errors in the data. I should have provided a less polished product to make clear that the images shown are but a guide and that if this is intended for use in other models the researcher should first replicate the work shown above to understand the processes before moving on other work.