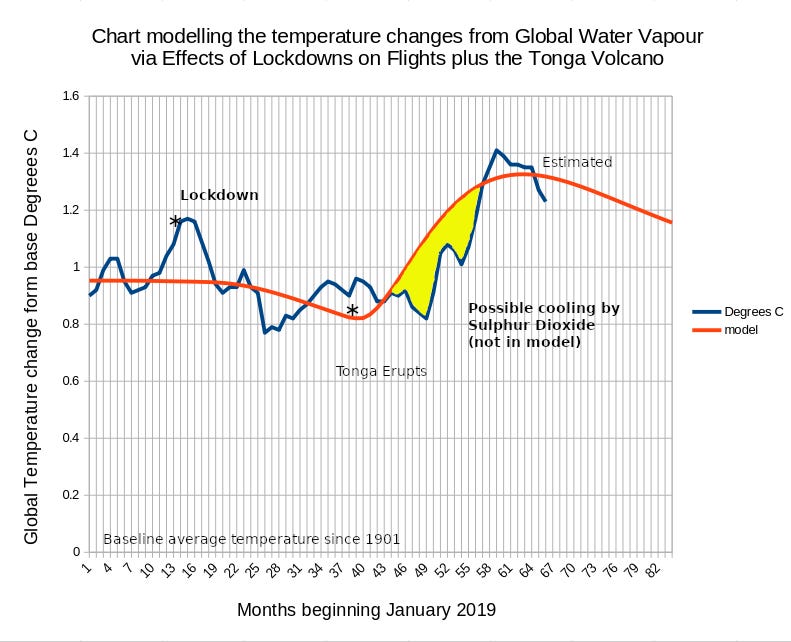
In August of 2024 I forecast that global temperatures would be 1.2C above the baseline average temperature since 1901. August 2025 is month 78 in the chart then published.[1]
Since that time there were no spectacular volcanic eruptions and modest growth in aircraft flights and growth in jet fuel consumption.
“In June, the International Energy Agency (IEA) revised its jet fuel outlook, forecasting consumption to reach 8 million barrels per day (bpd) by 2027, just above the 7.9 million bpd recorded in 2019. This is a downward adjustment from earlier projections that expected a full recovery to pre-pandemic levels by 2024. Although jet fuel demand grew 5.6% in 2024, the IEA now anticipates much slower growth rates of 1.32% in 2025 and 1.29% in 2026.” - 09/07/2025[2]
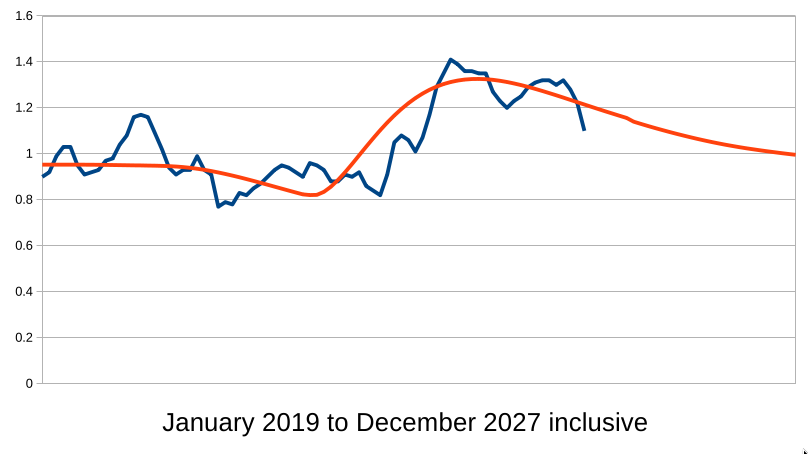
Hence increases in aircraft water vapour emissions from 2023 : +5.6%; +2.32%; and 1.29% can be added to extend modelling to year 2027. Also a forecasted increase of 1.27% over 2019’s data for the year 2027.
The projections allow relatively easy update in global jet fuel consumption to 2027 and hence global temperatures to 2027. Last years modelling forecast of 1.2C and recent drops in temperature provided some validation of the model as can be seen below.
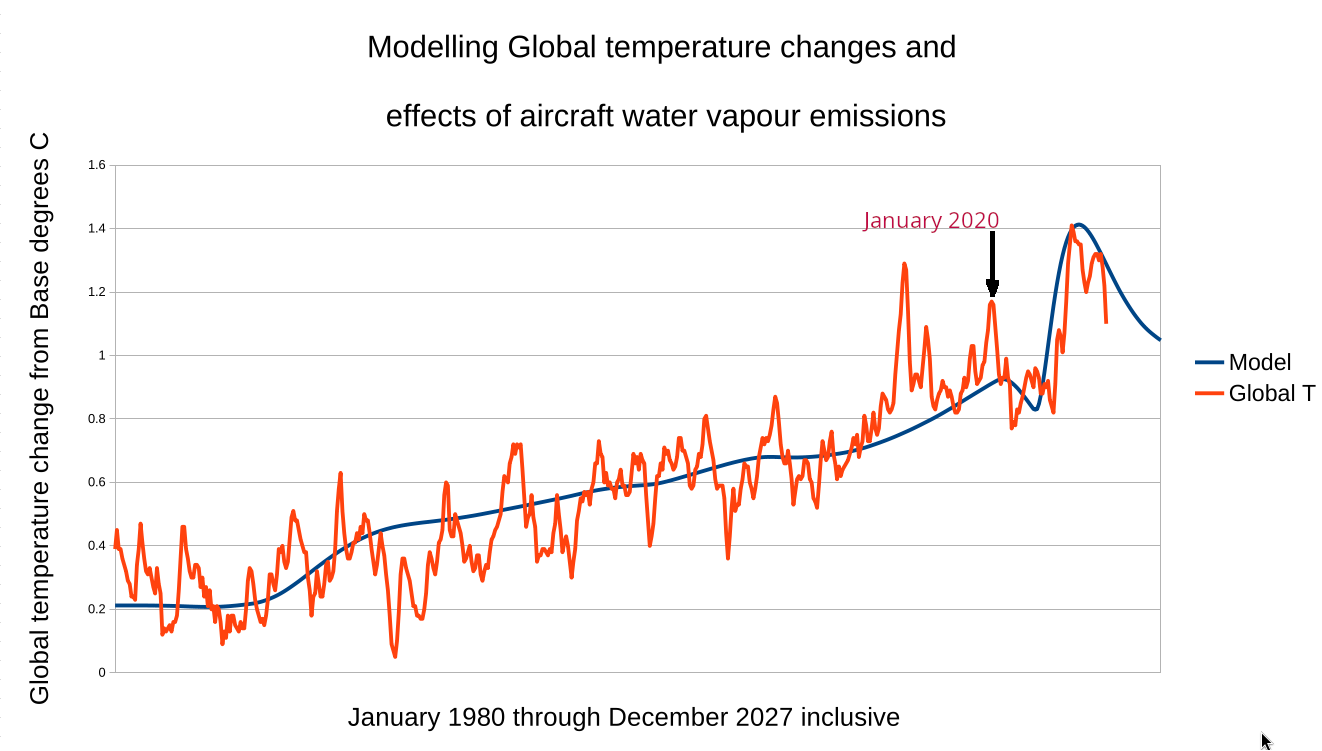
Attempting to extend the model back in time to the period from 1980 to the present highlighted some issues. Searches of the internet failed to provide a consistent and continuous table of annual jet fuel consumption. It was necessary to combine several tables with differing parameters to come up with a single dataset in billions of litres per year.

For example, the linked forecast suggested 7.9 million bpd were consumed in 2019. This equates to 458 billion litres. The number used in the modelling is the 368 billion litres consumed in 2019.

Unless and until better, verifiable numbers for jet fuel consumption back to 1980 are available, and until better models are produced, these numbers will remain the best available.
The chart from 1980 to 2027 has thrown up a slight problem with earlier modelling. This chart shows that in 2019, temperature increases were ongoing from increases in jet fuel consumption in prior years. Whether this matters depends on (a) whether jet fuel consumption is the main cause of increases in Global temperature, and (b) whether, over the longer term, a more accurate forecast of global temperature is needed.

For clarity, I’ve omitted some of the scaling referenced from the chart.

[1] https://richarda697.substack.com/p/forget_co2_focus_on_flight

[2] https://www.sorafutures.com/archives/18793

[3] https://www.ncei.noaa.gov/access/monitoring/climate-at-a-glance/global/time-series/globe/land_ocean/3/0/2019-2025