Catherine Austin Fitt’s Solari recently published a guide to inform US Lawmakers newly elected in 2024 how to go about the business of Reversing the Financial Coup.[1]

In my humble opinion an important detail was omitted : the economics of Government Deficit Spending. I outline here the economic argument and some recent US financial data.

The economic case is opened in 1908 by Jerome Levy who progressively analyses over 100 transaction types and as a small business owner, he had an interest in evaluating potential changes in profits caused by changes in the economy. Michal Kalecki followed a different route a generation later, eventually setting out, in 1969, an Economic Identity : The General Case Profit Equation. (GCPE) [2]

The political outlook of these two men differed, but they had the same goal. They wanted to create the greatest good from the least input. They lived in a different financial world, but their equation still holds.

GCPE == Investment – Savings + Export Surplus + Capital Consumption + Deficit

I could argue that in the long run, Savings = Investment; that eventually exports and Imports must balance; and Capital Consumption can be a rounding error. I need not make that effort. Given the state of finance extant in the USA right now, I can restate the above equation thus :

		Corporate Profits == Government Deficit Spending

To assess the truth of that statement I offer the following financial data for the exceptional 2020 year. Note that 2021 had similar financial excesses.

All figures in US$ Trillions (2020 fiscal year) :
US GDP : 		20.9
US Deficit spending : 	3.2

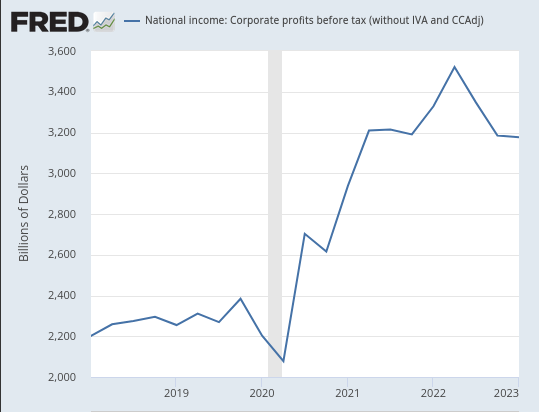
And 5-year quarterly data from the St Louis Fed Table A053RC1Q027SBEA
DATE,A053RC1Q027SBEA
2018-01-01,2202.037
2018-04-01,2258.834
2018-07-01,2274.868
2018-10-01,2295.174
2019-01-01,2254.933
2019-04-01,2311.3
2019-07-01,2269.075
2019-10-01,2383.929
2020-01-01,2202.657
2020-04-01,2078.07
2020-07-01,2702.715
2020-10-01,2615.907
2021-01-01,2937.989
2021-04-01,3209.367
2021-07-01,3214.189
2021-10-01,3190.746
2022-01-01,3328.491
2022-04-01,3521.785
2022-07-01,3347.843
2022-10-01,3185.64
2023-01-01,3176.76

The above figures show the annualised rate of Corporate Profits before tax. The chart below suggests that corporate reporting delays the appearance of profits in their accounts by some six months. [3]
To tidy up a loose end or two here, note that that is being said is that when Corporate Profits before tax exactly equal Government Deficit Spending, then all other components of the Profit Equation must sum to zero. That opens up a host of questions, but I will not detract from the central theme of this post.

Absent evidence to the contrary, understand that a dollar increase in Government Deficit Spending is another dollar removed from the pocket of a taxpayer and added to the Profit of the Corporate Sector. Modern Monetary Theory would have you believe that these things are unimportant.

I can only add that I never fail to be surprised to hear how people can look at the same facts and reach diametrically opposed conclusions. Such is life.


[1] Reversing the Financial Coup
https://audio.solari.com/Solari_Papers/SolariPapers-1-v5.pdf

[2] Jerome Levy Economic Institute : Working paper No 309
https://www.levyinstitute.org/pubs/wp309.pdf

[3] https://fred.stlouisfed.org/series/W987RC1Q027SBEA


