

Vaccination Status Error Estimates - Part I
ONS Report published 21 February 2023 refers

Foreword :
In an earlier post I hinted that I would take a deeper look at data provided by the ONS in their report : 'Age-standardised mortality rates for deaths by vaccination status, England' issued 21 February 2023. [1]
I use the term “error estimates” in the mathematical sense in this report, and I see the ONS as the data provider using best efforts to inform the public, and I thank them for their timely replies to my queries.
Summary :
The ONS Report of 21 February 2023 is essentially in two parts. The first part, Tables 1-4 attempts to standardise rates across the population on the basis of 100,000 person-years. The second part, Table 5, provides monthly counts of all registered deaths for 'unvaccinated' and 'ever vaccinated' by age group. Before attempting to deduce causal relationships between age, vax status, and mortality, I attempt to validate the data by comparison with other data [2] published by the ONS, and thereby estimate the magnitude of any errors preset in the data in Table 5. I refer to this as Phase I.
This process of measurement necessarily introduces other errors into the process, but their magnitude can be estimated, and found to be one percent or less, except for one or two occasions.
I find that Table 5 contains significant errors in the data provided for year 2022, suggesting that great caution be used in interpreting the data for some age groups but making the data invalid in others.
Background material :
The Report covers mortality in England only from April 2021 to December 2022. Prior months within the UK contain significant excess mortality, particularly for the elderly, hence it would not be surprising if the first three months of the data in Table 5 evidenced mortality below the average for those months in the period 2015-2019. Similarly, at the end of 2022, data may be subject to the vagarities of the holiday season, thus introducing errors into the Report.
Table 5 itself essentially contains two data fields : Unvaccinated (UnJabbed) and Ever Vaccinated (Jabbed). The two fields might be expected to provide a total for all-cause mortality of a particular population. Upon investigation I found a three percent discrepancy with other ONS data. After enquiry to the ONS a potential third data field became evident. Here is the ONS response :
/quote
Table 5 includes all deaths (that we could link to a vaccination status) and includes only counts of deaths.
Tables 1-4 are rates calculated from a subset of the population. We need to know how many people were alive and had each vaccination status as well as those who died.
To do this we use people in the 2021 Census as our base population, who could be linked to an NHS number for linking on deaths and vaccinations. This is a subset of the population (91.6% of the England population on Census day 2021) and therefore not include all of the deaths in Table 5 due to not including people who died who were not in the UK at the time of the Census or could not be linked to an NHS number.
/unquote
Hence a further field could be included in Table 5 for “unlinked” deaths.
To illustrate these effects listed above and to explore some other matters,
please see Figure 1 below, the chart for age group 60-69, with some additional data to extend the time period to March 2023.
These graphs are, in the anticipated order of scale : the estimated actual deaths for each month; the total deaths for each month in Table 5; the average expected deaths for each month for that age group during 2015-2019; the 'Jabbed' deaths for that month; and the 'UnJabbed' deaths.
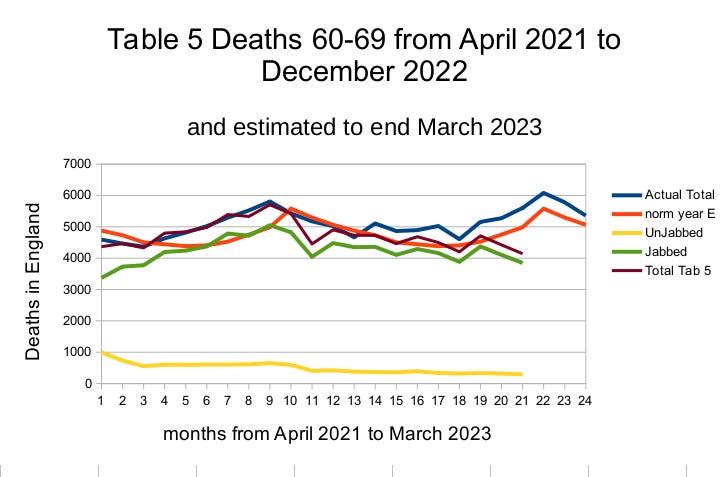
Figure 1
Notes : The ‘Actual Total’ and ‘Total Tab 5’ track fairly closely until 2022 begins, but after that they steadily diverge.
There are periods of excess deaths where the ‘Actual Total’ exceeds the ‘norm year E’.
The errors evident in 2022 seem to be attributable to ‘unlinked’ deaths that should be classified as 'Jabbed'.
As will be seen in further charts, the age group 60-69 is somewhat atypical. Those in elderly groups may be more likely to be in medical care and their data may thus be more reliable. Those in younger groupings may have less reliable and hence more error prone data.
I include estimates for January, February, and March of 2023 only in the chart for those aged 60-69, to illustrate the ongoing trend in data. The wider perspective on what this might mean is left to a later post.
The charts for age groups 18-39; 40-49; 50-59; 70-79; 80-89; and 90+ follow.

Figure 2

Figure 3

Figure 4

Figure 5

Figure 6

Figure 7
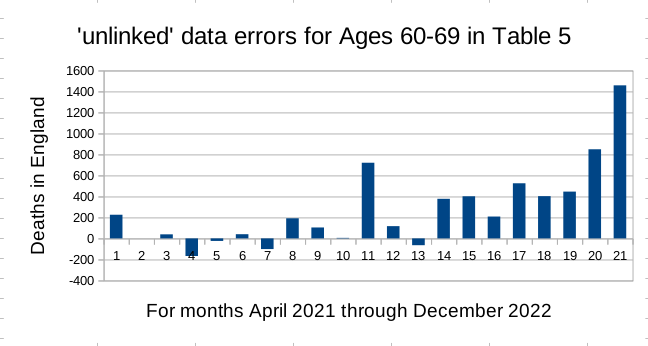
Figure 8
Source Material
[1] https://www.ons.gov.uk/file?uri=/peoplepopulationandcommunity/birthsdeathsandmarriages/deaths/datasets/deathsbyvaccinationstatusengland/deathsoccurringbetween1april2021and31december2022/referencetablefeb213.xlsx
[2] https://www.ons.gov.uk/file?uri=/peoplepopulationandcommunity/birthsdeathsandmarriages/deaths/datasets/deathsbyvaccinationstatusengland/deathsoccurringbetween1april2021and31december2022/referencetablefeb213.xlsx
[3] https://www.ons.gov.uk/file?uri=/peoplepopulationandcommunity/birthsdeathsandmarriages/deaths/adhocs/11485fiveyearaverageweeklydeathsbysexandagegroupenglandandwalesdeathsoccurringbetween2015and2019/fiveyearavgweeklydeaths2015to2019.xlsx
Here is what I think I am seeing : many of those aged below 60 are dying outside the NHS Hospital System, and those numbers increase through 2022, and in younger age groups. This trend is irrespective of the medical problems up to and including the risk of death.
This isn't an ONS problem.
This isn't a Medical Problem.
This is a Political problem.
I suggest that a majority aged 18-39 woke up during 2022. If given the chance they would end National Insurance payments and defund the NHS.